Every Albertan over 40 can describe the boom-bust cycle from memory: oil goes up, the province booms, oil crashes, small businesses fail. It's a true story in outline and a misleading one in the specifics, and the specifics are what a business owner actually needs to plan around.
This investigation pulled 13 government-published data series, Statistics Canada's Labour Force Survey and Business Dynamics tables, the Alberta Economic Dashboard's oil price series, and the Office of the Superintendent of Bankruptcy's annual insolvency reports, spanning 1976 to 2024 in most cases, and computed real Pearson correlation coefficients between them. No number below is estimated, and every correlation is reported honestly, including the ones that don't support a clean narrative.
Methodology, in plain language
A correlation coefficient, r, measures how closely two series move together on a scale from -1 (perfectly opposite) to +1 (perfectly together), with 0 meaning no relationship. This investigation computed r directly from the year-by-year government figures listed in the sources below, using standard Pearson correlation with no smoothing or estimation. Where a relationship might work with a delay, for instance oil price affecting bankruptcies a year later rather than the same year, both the same-year and one-year-lag versions are reported.
Five episodes anchor the analysis: the 1979-1982 boom into the early-1980s National Energy Program bust, the 1986 oil price collapse, the 2008-2009 financial crisis, the 2014-2016 oil price collapse, and the 2020 COVID/price-war crash into the 2021-2023 recovery. Not every data series has government-sourced coverage of every episode; where coverage is partial, that's stated rather than filled in.
The price line
West Texas Intermediate crude averaged $93.26 a barrel in 2014. By 2016 it averaged $43.14, a 53.7 percent collapse in two years. That single number is the trigger for most of what follows in this piece, and the government-sourced series for it only reaches back to 1986; no compliant government source in this investigation's search produced a precise annual WTI figure for 1979-1985, so the earliest NEP-era boom is described here through unemployment and migration data instead, both of which do have full coverage.
WTI crude oil price, annual average, 1986-2023
The benchmark North American oil price Alberta's producer economics track. Shaded bands mark the recognized bust windows discussed in this investigation.
Source: Government of Alberta Economic Dashboard (Treasury Board and Finance)
The one variable with the full 44-year picture
Alberta's unemployment rate is the only series in this investigation with unbroken Statistics Canada coverage across all five episodes, back to 1976. It shows the NEP-era bust with total clarity: 3.9 percent in 1981, up to 11.3 percent by 1984, a near-tripling in three years. It shows 2014-2016 almost as sharply: 4.8 percent to 8.2 percent. And it shows 2020's shock as the fastest of all, 6.9 percent to 11.4 percent in a single year, before falling to 5.8 percent by 2022.
Oil price and unemployment correlate at r = -0.50 across the full 1986-2023 overlap, moderate but not overwhelming. Narrow the window to 2005-2023, the era readers actually lived through, and the relationship tightens to r = -0.61. The lesson is not that oil price doesn't affect employment; it's that the relationship is real but partial, and gets stronger, not weaker, as the sample gets more recent.
Alberta unemployment rate, annual average, 1976-2024
The only variable in this investigation with unbroken government coverage across all five bust episodes, including the 1980s National Energy Program era.
Source: Statistics Canada, Labour Force Survey, Table 14-10-0464-01
The cleanest relationship in the entire dataset
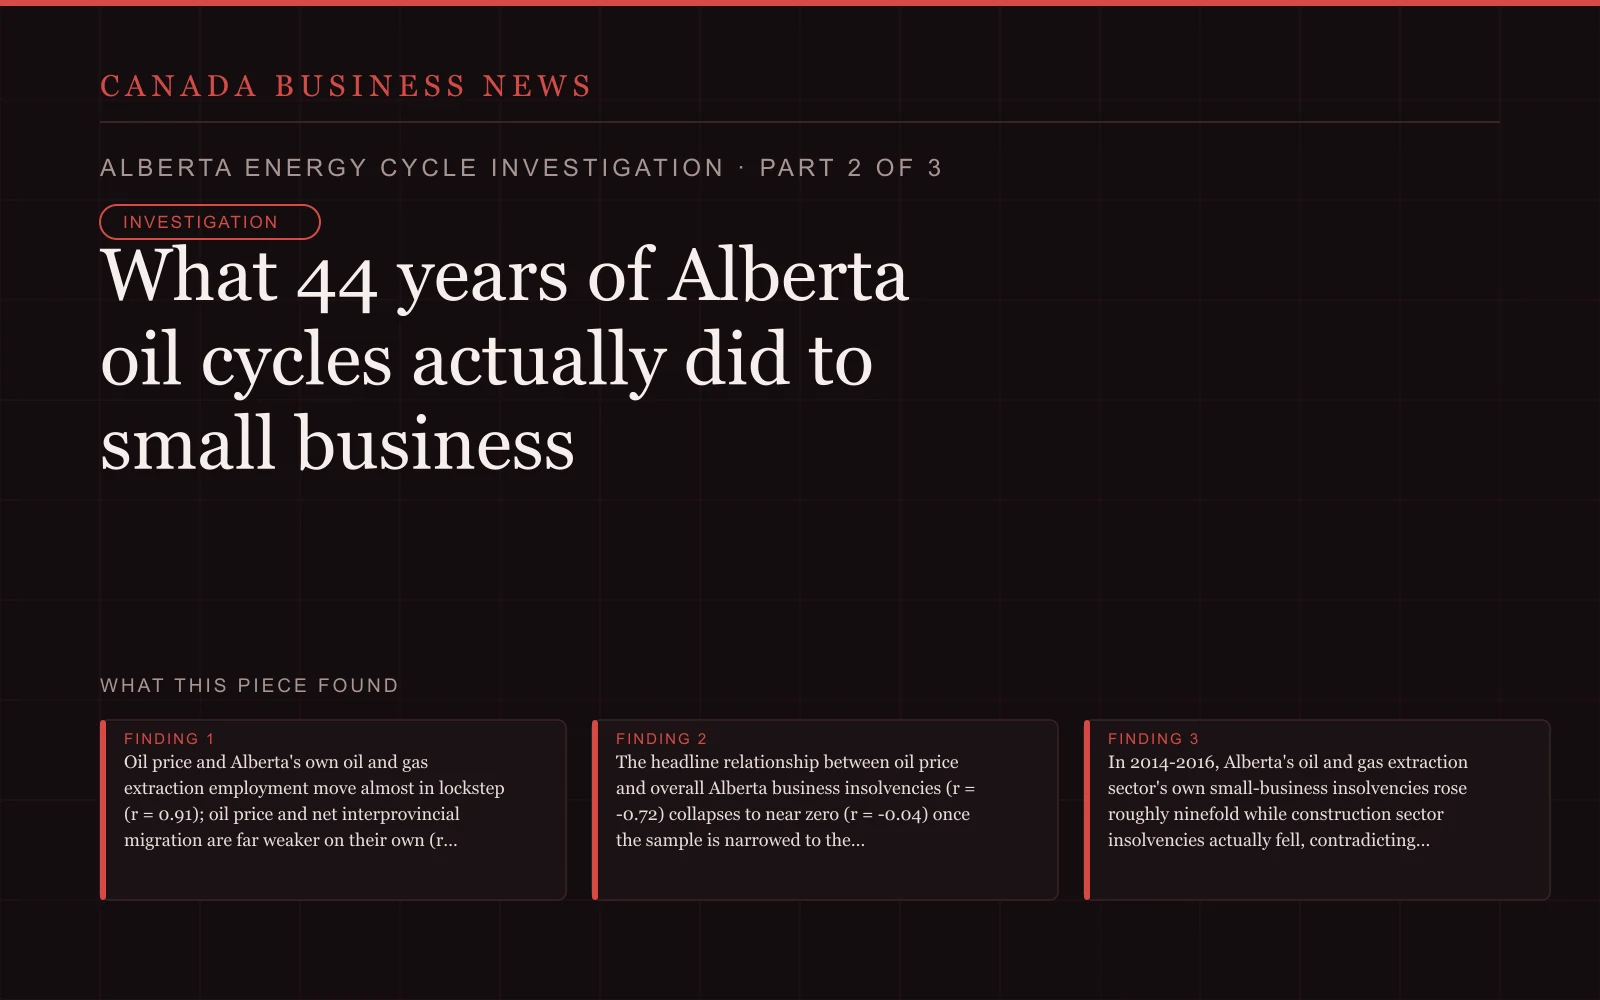
If there is one number in this investigation an Alberta small-business owner should actually remember, it's this: oil price and Alberta's own oil and gas extraction sector employment correlate at r = 0.913 across 37 years, 1987 to 2023. That is about as tight as real-world economic data gets. When indexed to a common starting point, the two lines are visually almost the same line.
This is the mechanical, direct relationship the boom-bust story is built on, and it holds up under scrutiny. It is also the narrowest one: it describes the sector itself, not the wider small-business economy that surrounds it, which is where the story gets more complicated.
Oil price and oil & gas extraction employment, indexed
Both series indexed to 100 at 1987, their first common year. This is the tightest relationship in the entire dataset: r = 0.913 across 37 years.
Source: Alberta Economic Dashboard; Statistics Canada Table 14-10-0023-01 (Both series indexed to 100 at 1987)
People vote with their feet, and the data shows exactly who's driving the vote
Alberta's net interprovincial migration, how many more people moved into the province than left it, swung from a positive 46,239 in 2006 to a negative 17,830 by 2016, and from a slump of negative 1,070 in 2019 to a positive 44,363 by 2023: a full round trip in under two decades.
What predicts that swing is not oil price directly. Oil price and migration correlate at a modest r = 0.373. Unemployment and migration correlate at r = -0.848, one of the strongest relationships in this entire investigation. In plain terms: people don't leave Alberta because the oil price fell. They leave because they, or people they know, can't find work, which is a related but genuinely distinct signal, and one that a local business can watch more directly than a commodity ticker.
Alberta net interprovincial migration, 1979-2023
People voting with their feet. This is the single strongest relationship in the dataset with the labour market: it correlates with the unemployment rate at r = -0.85.
Source: Statistics Canada Table 17-10-0020-01
The correlation that falls apart, and why that matters more than the ones that hold
Here is the finding that should change how Alberta small-business owners read the boom-bust story. Across the full 1986-2023 window, oil price and total Alberta business insolvencies correlate at r = -0.721, a strong relationship that appears to confirm the standard narrative: cheaper oil, more failed businesses.
Narrow that same comparison to 2005-2023, the period most readers actually remember living through, and the correlation collapses to r = -0.039, statistically indistinguishable from no relationship at all. The reason is a classic statistical trap: both series carry large, unrelated long-run trends. Total Alberta business insolvencies fell from a peak of 2,239 in 1995 to just 194 by 2013, an 91 percent decline over eighteen years that had far more to do with changes in insolvency law, lending practices, and the broader Canadian economy than with any single oil cycle. Oil price, over roughly the same span, had its own long upward run into the 2008 and 2013 peaks. Two series that are each drifting for their own separate reasons will show a strong correlation over a long enough window even if the year-to-year relationship in the period that matters is close to zero.
This is not a technicality. It means the intuitive, frequently repeated claim that Alberta's oil cycles reliably drive the province's overall small-business failure rate is, at the aggregate level and in the modern era, not well supported by the government's own insolvency data. Something else is going on, and the sector-level data below shows what.
Where the 2014-2016 bust actually landed
The Office of the Superintendent of Bankruptcy's sector-level filings solve the puzzle the aggregate numbers create. Between 2014 and 2016, Alberta's oil and gas extraction sector's own business insolvencies rose from 4 to 37, a roughly ninefold increase concentrated in the businesses most directly exposed to the price collapse.
Construction sector insolvencies, the sector most people assume gets hit hardest by an oil bust because it's downstream of every camp and facility build, actually fell over the same window, from 42 in 2014 to 33 in 2016. Retail trade rose modestly, from 11 to 24. Accommodation and food services fell over that same window, from 13 to 8, the opposite of what the standard narrative would predict.
The real 2014-2016 story, on the government's own numbers, is concentrated sectoral pain, not a broad-based collapse. The oil and gas extraction sector's own small businesses absorbed most of the visible insolvency damage. The sectors most people picture as the collateral damage of an oil bust, construction and hospitality, don't show that pattern in the same window. This doesn't mean those sectors felt nothing; the retail sales data below shows they felt something, just far more mildly than the price collapse itself.
Business insolvencies by sector, Alberta
Bankruptcies plus proposals combined. The oil & gas extraction sector's own small businesses absorbed most of the visible damage in 2015-2016; broader main-street sectors barely moved.
Insolvency filings
Source: Office of the Superintendent of Bankruptcy Canada, NAICS annual reports
The dampened echo in retail
Alberta retail trade sales fell from $78.99 billion in 2014 to $74.997 billion in 2016, a 5.1 percent decline, against a 53.7 percent collapse in oil price over the identical two years. Oil price and retail sales correlate strongly and positively across the full period (r = 0.806), but the amplitude tells the real story: Alberta's retail economy absorbed roughly a tenth of the shock the oil price itself took.
That's not nothing, a 5 percent sales decline is a real and painful number for a thin-margin retailer, but it's a fundamentally different planning problem than a business that assumed its revenue would move in lockstep with the price of crude. Alberta's broader small-business economy is buffered, not directly exposed, and the buffering is itself a government-documented fact worth building a plan around.
The churn signal, and where it actually shows up
Statistics Canada's business dynamics data, tracking how many Alberta employer businesses opened versus closed each year, offers the cleanest real-time distress signal in this investigation because it doesn't carry the long-run trend problem the insolvency count does. In 2014, 27,670 businesses entered and 23,280 exited, a healthy surplus. By 2016, entrants had fallen to 23,120 while exits rose to 28,560, the first year in the series exits outnumber entrants. The same pattern repeats, more severely, in 2020: 21,860 entrants against 29,500 exits, the highest exit count and exit rate in the entire series.
This is arguably the single most useful monitoring number in this whole investigation for an Alberta owner: not the oil price, not even the unemployment rate, but whether more businesses like theirs are opening or closing in a given year. It reflects the market's own real-time judgment, aggregated across every sector at once.
Alberta private-sector business entries and exits
2016 is the first year in this series exits outnumber entrants; 2020 sets the record. Both are the cleanest 'churn' signal of a bust in the small-business population itself.
Number of businesses
Source: Statistics Canada Table 33-10-0087-01, Business Dynamics Measures
The 2020-2022 confound
One more finding is worth reporting precisely because it looks paradoxical. Alberta business insolvencies fell in 2020, the depth of the COVID shock and a price war that briefly sent oil futures negative, from 223 in 2019 to 160, a 28.3 percent decline. They then surged in 2022, from 160 to 237, a 48.1 percent increase, even as oil price was simultaneously recovering strongly (from $39.23 in 2020 to $94.79 in 2022) and unemployment was falling (from 11.4 percent to 5.8 percent over the same span).
A reader following the oil-price story alone would expect insolvencies to fall as price recovers. They rose instead. The explanation isn't in the oil data at all: 2020's emergency federal support programs, deferred loan payments, direct relief, and court backlogs artificially suppressed insolvency filings that year, and 2022's spike reflects that suppressed pressure catching up as support wound down and interest rates rose, not a fresh reaction to energy markets. It's a textbook case of a single-variable narrative breaking down, and a reminder that the cleanest-looking correlation in a dataset is still just a description, not an explanation, until the mechanism behind it is understood.
What a business owner should actually take from this
Three things hold up under real scrutiny. First, if a business is inside the energy extraction sector itself, the price-to-sector-employment relationship is about as strong and fast as economic signals get; plan accordingly. Second, if a business is adjacent to but not inside that sector, retail, hospitality, most trades, the historical damage has been real but consistently smaller in amplitude than the headline price move, and construction specifically has not shown the aggregate insolvency spike many assume. Third, the fastest, cleanest real-time warning signals available to any Alberta owner are the unemployment rate and, even more directly, whether business entries or exits are winning in their own sector and region, not the oil price ticker itself.
The final piece in this investigation turns these findings into a concrete preparation framework: how to size a cash reserve, when to watch which signal, and how to structure growth during a construction-phase windfall so that it survives the operations-phase cliff this investigation's companion piece on approved pipeline projects documents in detail.
Government links used for this briefing
These links point to federal, provincial, territorial, municipal, intergovernmental, or official data sources. Readers should confirm current eligibility and deadlines directly with the issuing government before applying.
Official monthly WTI and WCS price data used to compute annual averages.
Federal / EvidenceLabour force characteristics by province, territory and economic region, annualStatistics CanadaOfficial annual unemployment rate series, Table 14-10-0464-01.
Federal / EvidenceGross domestic product, expenditure-based, provincial and territorial, annualStatistics CanadaOfficial Alberta real GDP levels, Table 36-10-0222-01, used to compute growth rates.
Federal / EvidenceHistoric Insolvency Statistics - AnnualOffice of the Superintendent of Bankruptcy CanadaOfficial annual business insolvency counts by province, 1987-2023.
Federal / EvidenceBusiness bankruptcies and liabilities, by type of industry, monthlyStatistics CanadaArchived table used for 1981-1986 Alberta business bankruptcy counts.
Federal / EvidenceMonthly retail trade sales by province and territoryStatistics CanadaOfficial current retail trade sales table, Table 20-10-0056-01.
Federal / EvidenceLabour force characteristics by industry, annualStatistics CanadaOfficial Alberta oil and gas extraction employment series, Table 14-10-0023-01.
Federal / EvidenceBusiness dynamics measures, by industry, per province or territoryStatistics CanadaOfficial business entries and exits by province, Table 33-10-0087-01.
Federal / EvidenceEstimates of the components of interprovincial migration, quarterlyStatistics CanadaOfficial net interprovincial migration series, Table 17-10-0020-01.
Federal / EvidenceNAICS annual bankruptcy reportsOffice of the Superintendent of Bankruptcy CanadaOfficial sector-level insolvency filings by province, source for the construction/retail/accommodation/extraction breakdown.
Federal / EvidenceFort McMurray 2016 Wildfire - Economic ImpactStatistics CanadaOfficial economic-impact estimate for the added 2016 wildfire disruption in the region.