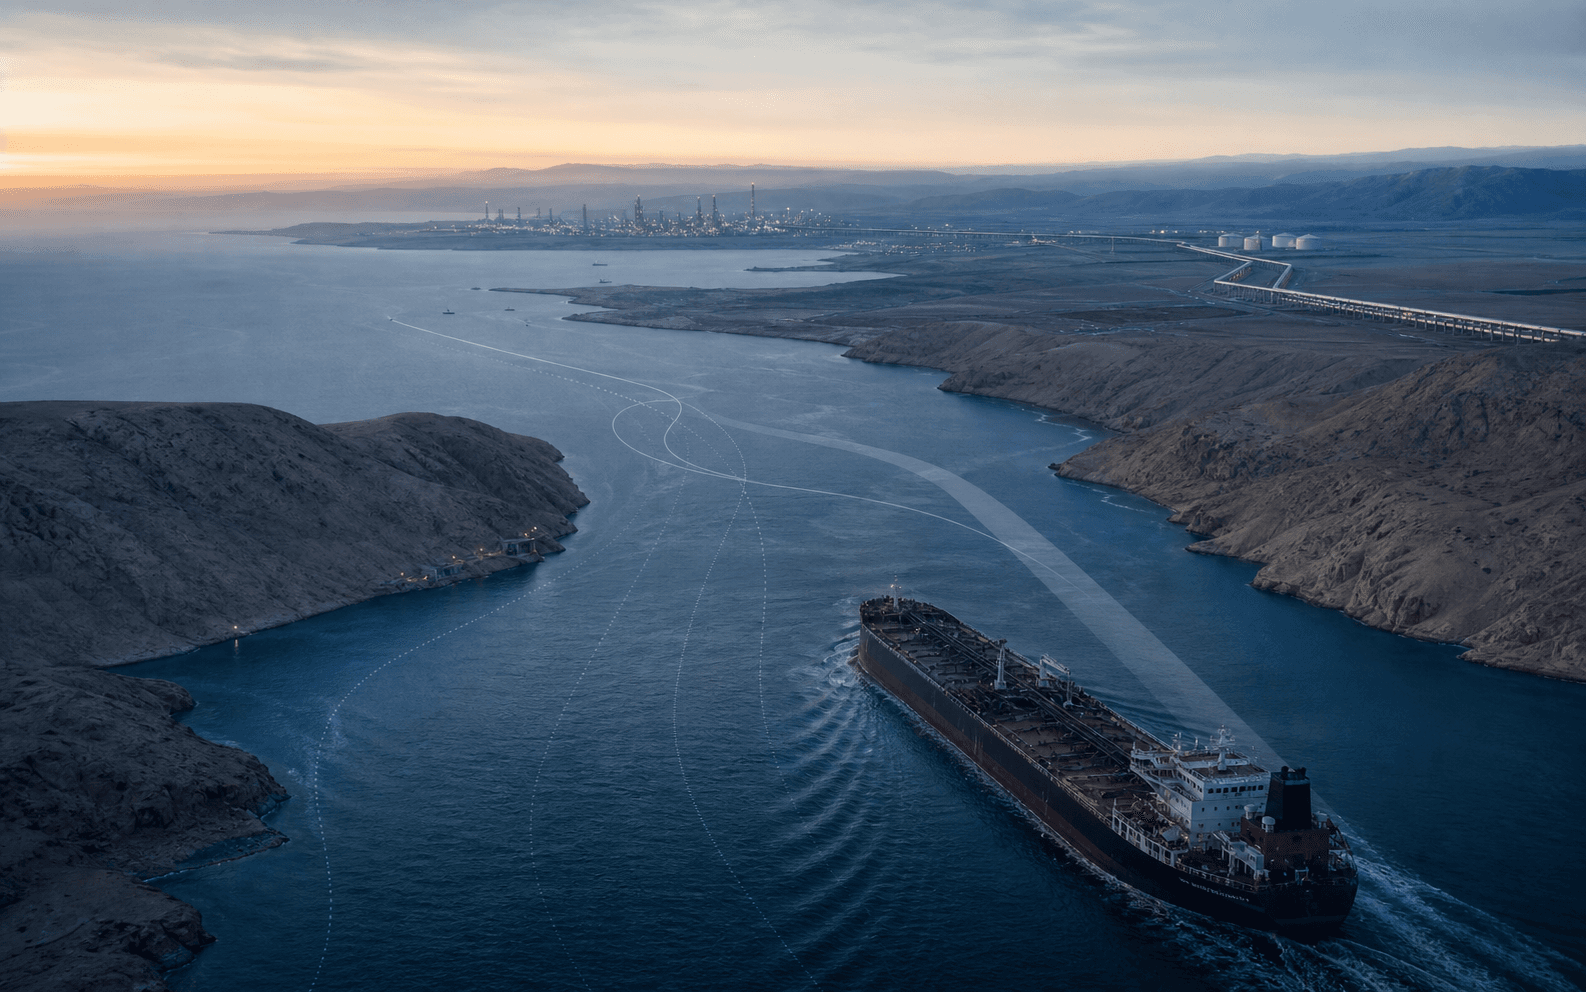
Reporting cutoff: August 28, 2026. The International Maritime Organization says the situation in the Strait of Hormuz remains unresolved. It has verified at least 70 attacks on international shipping and 19 seafarer deaths since the conflict began on February 28. The IMO estimates that up to 400 ships carrying around 6,000 seafarers remain unable to depart safely. Some protected or accepted traffic is moving, but the latest neutral maritime record does not support describing the Strait as normally, freely or safely reopened.
The energy scale is exceptional. The International Energy Agency estimates that 19.87 million barrels per day of crude oil and petroleum products crossed the Strait in 2025, around one quarter of global seaborne oil trade. The U.S. Energy Information Administration estimates that petroleum-liquid flows fell from 21.6 million barrels per day in the fourth quarter of 2025 to 4.9 million in the second quarter of 2026. Its LNG estimate fell from 10.5 to 0.8 billion cubic feet per day. These are official estimates built partly from vessel tracking, not physical meter readings, and electronic interference limits their precision.
For Canada, the result is mixed rather than simply positive. Higher global oil prices support producer revenue, exports, investment and some Prairie suppliers. The same shock raises gasoline, diesel, jet fuel, freight, fertilizer and petroleum-derived input costs across the country. This investigation labels observed data, official estimates, calculations and scenarios separately. Scenarios are planning cases, not forecasts. Conflict allegations are attributed to the official speaker when a neutral body has not established responsibility.
The answer today: limited movement is not normal navigation
Two official narratives sit beside each other. The White House said on August 28 that a U.S.-protected corridor had moved nearly 1,500 commercial vessels and 750 million barrels of crude, and that Gulf exports had recovered to about two thirds of the level before the operation. The page does not publish enough cargo-level method to turn those cumulative claims into a reliable daily flow or reconcile them with the IEA, EIA and IMO series. They remain attributed U.S. government claims.
The IMO provides the safest current wording. Some vessels have left and some cargo is moving, yet thousands of seafarers remain exposed, recent attacks have been verified and normal freedom of navigation has not been restored. Iran announced a closure without a recognized maritime safety notice formally suspending passage. For an operator, an announcement, a ship count, a cargo volume and a safety assessment answer different questions. Current routing, insurer, flag-state, port, bank and counterparty requirements still have to be checked for the specific movement.
The Strait is moving some traffic, but the crisis is unresolved
The latest neutral maritime record summarizes verified harm and the crews still unable to depart safely.
What this shows: The IMO called the Strait situation unresolved on 2026-08-28. It had verified at least 70 attacks and 19 seafarer deaths and estimated that up to 400 ships with around 6,000 seafarers could not depart safely.
Limit: This safety assessment does not mean that no ships are moving. It means normal, unhindered navigation has not been restored.
Source: International Maritime Organization, August 28, 2026. Records: IMO-STATUS-2026-08-28
Why this narrow passage matters to the world economy
The Strait joins the Persian Gulf to the Gulf of Oman and the Arabian Sea. The IEA puts its narrowest point at about 54 kilometres. Commercial traffic uses two channels about two miles wide in each direction, separated by a buffer. That physical opening is wider than many city commutes, but usable deep-water routes, traffic separation, coastal security and the lack of equivalent export routes make it a strategic bottleneck.
The 2025 IEA estimate divides normal oil movement into 14.95 million barrels per day of crude and condensate and 4.93 million of petroleum products. Most moved toward Asian markets. LNG exposure is different because a gas cargo cannot be sent through a crude pipeline. The IEA estimates that Gulf LNG exporters supplied almost 20 percent of global LNG before the conflict and that Qatar and the United Arab Emirates lack an equivalent seaborne export route around the Strait.
Saudi Arabia and the United Arab Emirates can bypass part of the route with crude pipelines. Official estimates vary with date and operating assumptions. The defensible range is roughly 2.6 to 5.5 million barrels per day of unused, practical or potential crude capacity. Even the high end cannot replace normal Strait oil flows, has not been proven under every sustained condition and does nothing for LNG, container cargo or most refined products.
A narrow passage carries an outsized share of global energy trade
The schematic locates the traffic lanes between Iran and Oman and distinguishes the main shipping route from crude-only bypass pipelines.
What this shows: A schematic map shows Iran north of the Strait, Oman to the south, the Persian Gulf to the west and the Gulf of Oman to the east. Two narrow shipping lanes carry oil and LNG, while Saudi and UAE bypass pipelines can move only part of crude supply.
Limit: The coastline is schematic and not suitable for navigation. Flow values are annual official estimates.
Source: Official IEA and EIA records. Records: IEA-HORMUZ-FACT, EIA-HORMUZ-BYPASS-2025, EIA-HORMUZ-BYPASS-2026
What the official flow estimates show
The EIA's like-for-like period comparison captures the first shock. Petroleum liquids moving through the Strait fell an estimated 77 percent between the fourth quarter of 2025 and the second quarter of 2026. Crude and condensate also fell about 77 percent, petroleum products about 81 percent and LNG about 92 percent. UN Trade and Development estimated that all-vessel transits dropped from about 130 per day in February to six per day in March, a decline of roughly 95 percent.
These numbers answer different questions. A vessel count includes tankers, bulk carriers, container ships and ballast movements. Petroleum flow measures cargo volume. Gulf export totals can include crude moved through bypass pipelines. Loadings can draw from storage and therefore need not match current production. None of those measures can be added or substituted for another.
Tracking itself is impaired. The IEA and EIA warn that ships have faced GPS jamming, AIS spoofing and incentives to stop broadcasting. A transponder can show an impossible location or no location at all. Daily charts can therefore look more exact than the underlying record. Quarterly and monthly official estimates remain useful for scale, but they are not a complete census of every ship or barrel.
Estimated oil and LNG flows collapsed after the conflict began
Like-for-like EIA period comparisons show the size of the disruption across crude, products and LNG, while UNCTAD records the vessel decline.
What this shows: Between Q4 2025 and Q2 2026, EIA estimated petroleum liquids moving through the Strait fell about 77 percent and LNG about 92 percent. UNCTAD estimated daily vessel transits fell about 95 percent from February 2026 to March 2026.
Limit: AIS interference and different source periods limit precision. Oil, gas and vessel units are not combined.
Source: U.S. Energy Information Administration and UNCTAD. Records: EIA-ENERGY-SECURITY-2026-08, UNCTAD-HORMUZ-2026-04-01
Six months of conflict, ceasefires and reversals
The conflict began on February 28 with U.S. and Israeli strikes on Iran, followed by Iranian attacks across the region. The United Nations confirms the broad sequence. Global Affairs Canada says Iran then announced the Strait's closure and threatened vessels. Maritime advisories did not record a formal closure through the recognized navigation-warning process, but attacks, mines, threats, electronic interference, insurance limits and owner decisions created a de facto commercial shutdown.
IEA members approved a 400 million barrel collective action on March 11. Canada did not announce a draw from a federal strategic petroleum reserve. Natural Resources Canada said the Canadian contribution would be 23.6 million barrels produced by industry and coordinated with federal and provincial governments. That distinction matters for readers assessing whether Canada has an emergency public stockpile comparable with some importing countries.
An April ceasefire and an Iranian reopening announcement did not normalize commercial traffic. Official records disagree on the exact date of the mid-June arrangement, so this analysis identifies it only as mid-June. The arrangement supported higher production, exports and an IMO evacuation framework. The IMO recorded 136 vessels and about 2,900 seafarers evacuated over four days before another attack caused the framework to be paused. Renewed vessel attacks and military action in July reversed much of the recovery. By August 28, the IMO still described the crisis as unresolved.
Ceasefires and partial movement did not restore normal navigation
The timeline keeps conflict claims, official actions, evacuation operations and verified maritime conditions in separate evidence states.
What this shows: The sequence begins with the February 28 outbreak, continues through the March IEA action, April reopening announcement, June agreement and evacuation, renewed July attacks, August Canadian sanctions and the IMO's unresolved-status finding on August 28.
Source: Official IMO, IEA, UN and Government of Canada records. Records: CA-GAC-SANCTIONS-2026-08-14, UN-SG-ME-2026-02-28, IEA-COLLECTIVE-ACTION-2026-03-11, CA-NRCAN-STOCKS-2026-03-13, UN-HORMUZ-2026-04-17, IMO-HORMUZ-2026-04-17, UN-DPPA-HORMUZ-2026-07-02, EIA-ENERGY-SECURITY-2026-08, IMO-EVAC-2026-06-23, IMO-EVAC-PAUSE-2026-06-25, IMO-INCIDENTS-2026-08-26, IEA-OMR-2026-08, IMO-STATUS-2026-08-28
Oil prices have been volatile enough to punish static plans
The EIA reported that front-month Brent traded as high as US$118 per barrel on April 29 and as low as US$72 on June 26. The IEA later recorded a spike to US$105 on July 23 after the mid-June improvement broke down, but its public overview did not identify the benchmark for that point. It reported North Sea Dated around US$92 near its August publication. Those are selected official crude-price observations rather than a complete daily series, but the calculated US$46 second-quarter range shows the planning problem.
A Canadian producer does not receive Brent by default. Western Canadian Select reflects heavy-oil quality, transport, refinery demand and competing supply. A carrier buys diesel or jet fuel, whose price also reflects refinery margins and product shortages. A restaurant feels the shock through deliveries and household demand. A useful plan therefore uses triggers and ranges, not one assumed oil price carried through the budget for twelve months.
Official reports recorded a wide oil-price range through the disruption
Selected official crude-price observations show why one benchmark number cannot support a stable business plan.
What this shows: EIA reported Front-month Brent futures at $118 on 2026-04-29 and $72 on 2026-06-26. The IEA public overview reported $105 on 2026-07-23 without specifying the benchmark and North Sea Dated around $92 at its 2026-08-12 report cutoff.
Limit: Selected points reported by EIA and IEA, not a complete daily price series. The EIA and IEA markers use different benchmark definitions, and the August value is approximate.
Source: U.S. EIA and International Energy Agency. Records: EIA-MARKETS-2026-07-15, IEA-OMR-2026-08
How a Gulf disruption reaches a Canadian company
Lower Gulf crude supply puts pressure on global benchmarks, which can lift Canadian producer revenue and refinery feedstock cost at the same time. Refined products move through a separate market: a shortage of diesel, gasoline or jet fuel can raise transport costs even when crude exists elsewhere in the system. Lost Gulf LNG cargoes change competition for gas and fertilizer inputs in import-dependent markets.
Maritime risk adds war-risk cover, route changes, port delays, vessel screening and uncertain arrival dates, tying up inventory and working capital. The demand effect arrives when households spend more on gasoline or air travel and less on restaurants, furniture, vehicles and discretionary services. In the Bank of Canada's survey, firms outside the Prairies reported weaker activity expectations linked to elevated fuel costs and uncertainty.
These channels overlap with U.S. tariffs, exchange rates, weather, refinery maintenance and major-event travel demand. A Canadian owner should resist assigning every price movement to Hormuz. The better question is whether a specific invoice, route, contract, customer or financing line has a documented exposure that the business can change.
The shock reaches Canada through more than the crude benchmark
Crude, products, LNG, shipping risk and non-energy cargo each move through a different commercial channel.
What this shows: The diagram traces crude supply into prices and producer income, product shortages into transport costs, LNG and fertilizer disruption into industrial inputs, shipping risk into freight and insurance, and household fuel bills into weaker discretionary demand.
Source: IEA, Bank of Canada and Statistics Canada. Records: IEA-OMR-2026-08, IEA-GAS-2026-Q3, BOC-BOS-2026-Q2, STATCAN-IPPI-2026-07
Canada is a net oil exporter, not an island from world prices
The Canada Energy Regulator reports that Canada produced an average 5.35 million barrels per day of crude oil and equivalents in 2025. Canada exported 4.3 million barrels per day of crude and imported 506,000. The calculated national balance was 3.794 million barrels per day of net crude exports. That is a structural advantage compared with an importing economy, but it is not spare production ready to replace every disrupted Gulf barrel.
Canadian refineries processed about 1.6 million barrels per day in 2025. Production, exports, imports and refinery runs describe different stages and cannot be added into a supply total. Crude can be produced in Alberta, committed to a U.S. refinery, incompatible with a particular eastern refinery or unable to reach a coastal market at the required time. Geography and configuration sit between national abundance and a business's fuel bill.
Finance Canada's Spring Economic Update captures the two-sided result. Higher energy income and government revenue can support parts of the economy, while higher household and business costs and greater uncertainty weigh elsewhere. Its scenarios do not justify calling the event a Canadian windfall. Nominal income can rise while real demand and margins weaken.
Canada exports far more crude than it imports, but still runs a regional refining system
Production, exports, refinery runs and imports are shown together as separate system measures rather than added into one total.
million barrels per day
What this shows: Canada produced 5.35 million barrels per day in 2025, exported 4.3 million, ran 1.6 million through refineries and imported 0.506 million. The measures describe different parts of the system.
Limit: Production, trade and refinery runs describe different parts of the system. They are compared at a common annual daily rate but must not be added as a single total.
Source: Canada Energy Regulator, 2025 records. Records: CER-OIL-PRODUCTION-2025, CER-US-ENERGY-TRADE-2025, CER-CRUDE-IMPORTS-2025, CER-REFINERY-RUNS-2025
Canada can raise output at the margin, but export routes are already busy
The Enbridge Mainline averaged 3.08 million barrels per day in 2025 against stated capacity of 3.23 million, or 95.2 percent utilization. Keystone averaged about 585,000 barrels per day against 607,000 of available capacity. Trans Mountain averaged 761,000 against 892,000, or about 85 percent. These annual averages show high utilization. They do not establish the space available on a particular day, which also depends on nominations, operating conditions and terminal constraints.
Trans Mountain gives western producers a valuable route to Pacific customers, including Asia. The existing route supports diversification and price competition. Its annual capacity still cannot be read as a promise that Canada can replace disrupted Gulf flows quickly.
The Bank of Canada's Calgary consultations found that conventional producers could respond faster than oil sands projects. Oil sands firms were mainly intensifying existing operations and making marginal budget additions rather than launching immediate large expansions. Higher prices can support maintenance, debottlenecking, drilling and service activity while long construction, approvals, labour and equipment cycles limit the speed of a larger response.
Three major crude export pipelines ran at high annual utilization in 2025
The plotted records describe annual use, not capacity available on a particular day.
percent of stated capacity
What this shows: The Enbridge Mainline averaged 95.2 percent of stated capacity in 2025. Keystone was about 96.4 percent and Trans Mountain about 85.3 percent by calculated annual utilization.
Limit: Annual averages do not establish capacity available on a specific day. Operational constraints and nominations can reduce practical headroom.
Source: Canada Energy Regulator, 2025 pipeline throughput. Records: CER-PIPELINES-2025
Refining geography explains why eastern exposure looks different
Canada's refineries are not one interchangeable national plant. The CER reports a 2024 structural capacity measure of roughly 1.9 million barrels per day, while its 2025 records show high refinery runs across western Canada, Ontario, Quebec and the East. East Coast refineries have no crude pipeline connection and depend on marine and rail supply. New Brunswick imported about 270,000 barrels per day of crude in 2025 for a refinery with 320,000 barrels per day of capacity. Quebec imported 126,000 and Ontario 87,000.
Most Canadian crude imports came from the United States in 2025, not directly from the Persian Gulf. That does not remove global exposure. Atlantic marine cargoes, U.S. refinery economics and benchmark prices respond to the same world market. Canada also imported about 485,000 barrels per day of refined petroleum products, with the United States supplying 79.6 percent. A disruption in Gulf products can tighten Atlantic Basin diesel or jet fuel even when the Canadian cargo did not sail through Hormuz.
Regional imports are refinery-feedstock measures, not a ranking of household vulnerability. Alberta imports large product volumes that include condensate used to move bitumen, while Quebec, Ontario, British Columbia and Atlantic markets import more transportation fuels. A province comparison must keep those products and system functions visible.
Selected eastern regions imported substantial refinery feedstock in 2025
National net exports coexist with substantial imported refinery feedstock in New Brunswick, Quebec and Ontario.
thousand barrels per day
What this shows: New Brunswick imported about 270 thousand barrels per day of crude in 2025, Quebec 126 thousand and Ontario 87 thousand. These are refinery-feedstock measures, not household fuel rankings.
Limit: Regional imports measure refinery feedstock, not retail fuel dependence. Totals are rounded.
Source: Canada Energy Regulator, Canadian crude imports in 2025. Records: CER-CRUDE-IMPORTS-2025
Natural gas offers diversification, not an instant Gulf substitute
Canada produced 19.0 billion cubic feet per day of marketable natural gas in 2025. Alberta and British Columbia accounted for almost all of it. Pipeline exports averaged 8.6 billion cubic feet per day and went almost entirely to the United States. LNG exports averaged 0.295 billion cubic feet per day on a full-year basis after LNG Canada opened an Asia-facing route.
That new outlet matters for British Columbia producers and Canada's long-run market diversity. It remains small beside the Gulf LNG trade and beside Canada's continental pipeline exports. Only one long-term Canadian LNG export licence was active as of early 2026. Approved licences and proposed terminals are not operating capacity and should not be counted as a current response.
Global Affairs Canada's summer assessment found limited transmission from global LNG prices into the North American gas market because export capacity remains constrained. Canadian gas and LNG businesses can see stronger demand and strategic interest without receiving the full price signal facing import-dependent Asian or European buyers.
The household and business cost shock is already visible
Statistics Canada reported that gasoline prices were 25.7 percent higher in July 2026 than a year earlier. The energy index was up 16.6 percent. All-items CPI rose 3.0 percent, while CPI excluding gasoline rose 2.2 percent. The gap shows the direct fuel contribution without claiming that every part of inflation came from the war.
The Bank of Canada estimated that the higher gasoline price added about 1.4 percentage points to inflation at its second-quarter peak under the July outlook. It also expected some indirect pass-through from transportation and petroleum-derived inputs. Those are official estimates under a dated oil-price path, not a guarantee about later inflation after renewed hostilities.
Air transportation prices were 12.0 percent higher than a year earlier in July. Statistics Canada linked part of the acceleration to jet-fuel costs, while other demand factors also mattered. For a business, that means travel budgets, field-service routes, employee commuting and customer demand may change at different speeds.
Gasoline rose much faster than Canada's broader consumer-price basket
July's year-over-year measures show the direct fuel shock beside all-items and gasoline-excluded inflation.
year-over-year percent change
What this shows: In July 2026, gasoline prices were 25.7 percent above a year earlier and the energy index was up 16.6 percent. All-items CPI was up 3.0 percent and CPI excluding gasoline 2.2 percent.
Limit: Year-over-year changes include factors beyond the conflict. Statistics Canada linked gasoline and part of air-fare acceleration to energy conditions.
Source: Statistics Canada, Consumer Price Index, July 2026. Records: STATCAN-CPI-2026-07
Producer prices show the shock spreading into materials
Canada's Industrial Product Price Index rose 12.4 percent year over year in July. Energy and petroleum products were up 42.0 percent, diesel 50.3 percent, finished motor gasoline 44.7 percent and plastic resins 46.3 percent. These are factory-gate prices received by Canadian producers, not consumer prices and not the exact input increase for every buyer.
The material detail matters. Resins move into packaging, construction products, vehicle components, medical goods, foam and finished plastics. Diesel moves through trucking, heavy equipment, fishing, mining and agriculture. A business that watches only its fuel card can miss the supplier increases already moving through quotes and purchase orders.
Owners should separate a commodity-linked increase from a supplier's total price change. Ask for the effective date, unit, surcharge basis and review condition. A temporary surcharge with a benchmark trigger is commercially different from a permanent list-price increase with no reversal mechanism.
What Canadian businesses are actually doing
The Bank of Canada's second-quarter survey is the strongest current official record of business behaviour. Nearly three quarters of firms reported cost increases connected with the war, largely through fuel, shipping and transportation. Some also cited petroleum-derived products such as resins and foams. The survey window ran from May 1 to May 21, so it does not capture every development after renewed July attacks.
Among firms with war-related cost increases, roughly 40 percent said they were not passing the increase to customers, 25 percent were passing through only part and about one third were passing it through fully over the next twelve months. Weak demand, competition, long-term contracts and fixed price-setting schedules held some firms back. Fuel surcharges, cost escalators and fixed-margin models enabled others to transfer more of the cost.
The Bank also found that some firms bought inputs earlier, adapted production, shipping or customs arrangements, diversified into new industries or monitored Gulf conditions more closely. Oil producers reported maximizing existing capacity and raising selected production and investment plans. These are survey findings from participating firms, not a claim that every company has taken the same step.
Most affected firms were not planning to pass through every added cost
The Bank of Canada survey shows how weak demand, competition and contracts split the commercial response.
approximate percent of affected firms
What this shows: Among firms reporting war-related cost increases, roughly 40 percent planned no pass-through, 25 percent partial pass-through and about 33 percent full pass-through over the next 12 months.
Limit: Bank of Canada wording is approximate. Rounded categories do not sum to 100 and the survey is not a census.
Source: Bank of Canada, Business Outlook Survey, second quarter 2026. Records: BOC-BOS-2026-Q2
A province map needs channels, not a false league table
No one official number ranks provincial exposure. Production shares measure direct commodity upside. Crude and product imports measure refinery or supply structure. CPI measures household prices. Fuel-tax policy, royalties, freight distance and industrial mix answer still other questions. Combining them into a single score would conceal more than it reveals.
The analysis therefore uses channels. Producing provinces have revenue, investment and supplier exposure. Refining provinces have feedstock, product and maintenance exposure. Large manufacturing and consumer markets face freight, petrochemical input and discretionary-demand effects. Northern and remote regions face long transport distances, thinner inventories and fewer substitutes. Current official records do not support a Hormuz-specific estimate for Manitoba or for any individual territory, so those places are not assigned a numeric impact. The direction can also differ inside the same province.
Alberta and Saskatchewan: the clearest direct upside, with local costs attached
Alberta produced 83.8 percent of Canadian crude and equivalents in 2025. Saskatchewan produced 8.2 percent. The Bank of Canada found that Prairie firms had stronger sales, investment and hiring outlooks than in the prior quarter, driven mainly by businesses in or connected to oil. Conventional drilling, maintenance, engineering, equipment rental, camp services and specialized transportation can receive orders before a large new project appears.
Higher revenue does not reach every Prairie firm. Producers may be hedged, face a wider heavy-oil differential or lack pipeline space. Service companies can encounter labour and equipment constraints. Farmers, truckers, construction firms, restaurants and households still buy diesel and gasoline at global-linked prices. Provincial royalty revenue can improve, but that fiscal effect depends on production, realized price, exchange rate and royalty rules.
A Prairie supplier should not hire against a headline benchmark alone. It should seek a contract, customer schedule or funded maintenance program, check whether the work survives a lower-price trigger and model the working capital required to mobilize crews before payment arrives.
British Columbia: Pacific access, LNG growth and coastal fuel exposure
British Columbia sits on both sides of the shock. Trans Mountain and Westridge give Canadian crude access to Pacific buyers. LNG Canada has created an Asia-facing outlet for western gas. Higher utilization and strategic demand could create work for producers, pipeline contractors, marine services and industrial suppliers. That is a newsroom inference from the infrastructure and survey record, not a measured sector result.
The province also imports refined products and has a segmented coastal fuel market. Port constraints, refinery operations, rail and pipeline availability can all affect local supply. Tourism, aviation, forestry hauling, construction and remote communities pay the transport cost. A stronger energy corridor does not automatically mean a lower price at a Vancouver or northern pump.
For LNG-related businesses, distinguish operating Phase 1 volumes from future expansions. A proposed project may support business development, but it does not supply the current market until financing, construction, commissioning and export operations are complete.
Ontario and Quebec: refining strength beside manufacturing and demand risk
Ontario and Quebec both have large refining systems. Western Canadian and U.S. crude reach much of that system by pipeline, while Quebec also has marine access. Refinery and petrochemical businesses can see stronger product prices in a tight market, but feedstock, maintenance, configuration and product mix decide whether that becomes stronger margin.
Manufacturers face fuel and petroleum-derived input costs while already managing U.S. tariffs. Ontario auto and parts businesses, plastics converters, metal fabricators and distributors may not be able to separate the two shocks cleanly. Commodity pricing could support some Quebec aluminum producers while processors pay more for metal, but that is a conditional market channel rather than an observed province-wide result. Weak household demand can offset export or price gains.
The Bank's survey found activity expectations weakening outside the Prairies. That is a regional survey signal, not a provincial recession forecast. Owners should use their own customer mix, energy intensity, delivery radius and contract position to determine whether the dominant channel is cost, demand or opportunity.
Atlantic Canada and the North: marine supply and distance amplify exposure
New Brunswick's refinery is Canada's largest and a major exporter of refined products, yet its crude arrives without a pipeline connection. Marine conditions, feedstock selection and Atlantic Basin product markets therefore matter directly. Newfoundland and Labrador has offshore production upside, but marine operations, project cycles and local fuel costs remain separate questions.
Nova Scotia, Prince Edward Island and many Atlantic communities rely heavily on shipped petroleum products, heating fuel, trucking, fishing and seasonal travel. A regulated pump price can pass global benchmark changes through a formula rather than remove exposure. Local demand can weaken if visitors or residents spend more on transport.
Territorial and remote businesses face long routes, small inventories and limited supplier choice. Diesel, aviation and sealift costs can reach retail, construction, mining and essential services. No current official dataset isolates the Hormuz share of a northern invoice, so the article treats this as a structural exposure that each operator must verify.
The sector matrix: opportunity is conditional and cost moves at different speeds
Official surveys and market records point to a conditional near-term opportunity for upstream producers and some oilfield-service firms. Refiners, fertilizer and petrochemical producers may see higher selling prices, but feedstock, outages and customer demand determine whether revenue becomes margin. Trucking, aviation, fishing, construction and manufacturing face direct cost channels. Retail, restaurants, tourism, furniture and vehicles face demand risk when households pull back.
Timing is as important as direction. A fuel card changes quickly. A resin price can arrive with the next supplier order. Fertilizer purchased before seeding may delay the operational impact to another season. A capital project or drilling program reaches engineering and contractors after approval. A customer-demand slowdown can appear first in enquiries, then orders, then receivables and staffing.
Every matrix row is a newsroom inference anchored to the cited official price, infrastructure or survey record. It is not a measured sector result, score or forecast. A refinery with secured feedstock can differ from another in the same sector. A trucking firm with an indexed surcharge can protect margin but still lose volume. A restaurant in an energy town may benefit from local activity while a similar restaurant in a tourism market loses discretionary demand.
Sector direction depends on the channel, timing and constraint
The same energy shock can raise revenue for a producer, cost for a carrier and demand risk for a restaurant.
What this shows: The matrix compares nine sectors. Upstream oil and oilfield services have conditional opportunity, refining and agriculture are mixed, transport and manufacturing face cost pressure, consumer sectors face demand pressure, and efficiency suppliers have a medium-term opportunity.
Source: Official records listed by source ID for each row. Records: BOC-BOS-2026-Q2, CER-OIL-PRODUCTION-2025, CER-PIPELINES-2025, IEA-OMR-2026-08, CER-REFINERY-RUNS-2025, STATCAN-IPPI-2026-07, STATCAN-CPI-2026-07, IEA-GAS-2026-Q3, CA-FIN-SPRING-UPDATE-2026
Energy producers, oilfield services and refiners
Producers should model realized price rather than the international headline. The bridge includes WTI or Brent, the WCS differential where relevant, quality, transport, royalties, hedging, currency and operating cost. A higher benchmark accompanied by a wider differential or constrained takeaway may deliver less cash than the headline suggests.
Service firms should distinguish recurring maintenance and short-cycle drilling from a speculative megaproject. Purchase orders, rig schedules, turnaround dates and approved producer budgets are stronger hiring signals. Equipment and labour availability can improve price but also raise the cost of fulfilling work.
Refiners sit between expensive feedstock and scarce products. High product cracks can support revenue, while crude supply, configuration, maintenance, regulation and local product demand determine margin. Public Canadian data does not provide refinery-level inventories or margins at the frequency needed to declare individual winners.
Trucking, rail, marine transport and aviation
Diesel and jet fuel reach these sectors immediately. A fuel surcharge protects a carrier only if the contract defines the benchmark, lag, base price, calculation and reversal. A surcharge can also raise the customer's delivered cost and reduce shipment volume. Owners should track margin per route after fuel and empty kilometres, not just revenue per load.
Marine businesses face route safety, war-risk insurance, vessel screening, port instructions and crew welfare. A Canadian firm that never sends a ship into the Gulf can still receive a higher freight quote when vessels, crews and insurance capacity are diverted. Rail can substitute for some movements but has its own capacity, terminal and commodity constraints.
Airlines and travel businesses must balance fuel, fare and demand. Higher fares can recover cost from passengers who still travel, while price-sensitive leisure demand weakens. Corporate travel, remote work and route frequency can move in response. A tourism operator should watch cancellations, booking lead time and customer origin alongside the fuel line.
Agriculture, fisheries, forestry, mining, construction and manufacturing
Agriculture faces diesel, fertilizer, drying, irrigation and freight. Gulf gas and fertilizer disruption can raise the value of Canadian supply while increasing farm input costs, a conditional inference from official gas and producer-price records. Inventory timing matters because some growers bought ahead of the shock. A farm should model the next purchase window and crop-price offset rather than applying one current fertilizer quote to the full year.
Fishing and forestry operations burn fuel in vessels, harvesters and trucks, often far from dense supplier networks. Mining and construction use diesel, explosives, resins, equipment and remote logistics. Fixed-price bids can convert a commodity shock into margin loss unless the contract allows escalation or the quote validity is short enough.
Manufacturers should trace petroleum-derived inputs below the top supplier. Resin, foam, packaging, adhesives, lubricants and freight can arrive inside a component price. The supplier's country does not identify the feedstock's market exposure. A bill-of-material review by spend and lead time gives a more useful risk picture than a list of Middle Eastern vendors.
Retail, restaurants, hospitality, technology and professional services
Consumer-facing businesses often feel the second round. The Bank found weaker outlooks in travel, dining, furniture and vehicles as higher gasoline costs squeezed household budgets. Retailers may also pay more for distribution and plastic packaging. Raising price can protect unit margin and reduce volume, so operators need a demand response case as well as a cost case.
Technology and professional firms use less fuel directly, but clients may cut projects, delay hiring or demand savings. Energy clients may accelerate field systems, cybersecurity, maintenance software and data work. Transport and manufacturing clients may prioritize route optimization, inventory visibility and procurement tools. The opportunity belongs to a funded operating problem, not to the word energy in a sales pitch.
Accountants, lenders and advisers should update forecasts with operational evidence. A bank balance does not reveal whether a customer can reprice. A contract does. A gross-margin report does not reveal route exposure. A fuel and freight ledger does. The response should connect financial planning to the physical operation.
Three scenarios for a fuel-intensive Canadian business
Canada Business News selected every assumption in this illustration and assigned no probability to any case. The hypothetical company spends CAD 120,000 a year on fuel and CAD 180,000 on freight. Illustration A assumes those costs rise 10 percent and the company passes 75 percent of the increase to customers, leaving CAD 7,500 unrecovered. Illustration B assumes a 25 percent increase and 50 percent pass-through, leaving CAD 37,500.
Illustration C assumes a 50 percent cost increase and 25 percent pass-through, leaving CAD 112,500 unrecovered. The derived calculation equals 37.5 percent of the original fuel and freight spend. At a 10 percent gross margin, CAD 1.125 million of additional revenue at the same margin would be required to replace that amount before considering any volume loss.
Owners should replace every assumption with their own data. Separate fuel from freight when contracts treat them differently. Include supplier surcharges, route changes, inventory finance and customer losses if they are material. Do not assume a passed-through dollar is harmless if the higher price reduces volume or extends receivables.
A fuel-intensive firm's unrecovered cost depends on both the shock and pricing power
The illustration holds annual fuel and freight spending at $300,000 and changes the assumed cost increase and pass-through share.
illustrative unrecovered annual cost, CAD
What this shows: For a hypothetical business with $120,000 of annual fuel spend and $180,000 of freight spend, unrecovered annual cost ranges from $7,500 to $112,500 under three visible assumptions.
Limit: Illustrative arithmetic for a hypothetical business. Cost increases and pass-through shares are assumptions, not forecasts or estimates of a specific company.
Source: Canada Business News calculation. Records: Canada Business News calculation
The first 48 hours: build an exposure register
Start with the last twelve months of fuel, freight, air travel, marine, fertilizer and petroleum-derived input spending. Group it by supplier, route, product and contract. For each exposure, record the responsible role, source system, last refresh date, benchmark or surcharge formula, current price, quote expiry, payment terms, trigger threshold and required action. The output should identify the ten lines most capable of moving cash or margin.
Map sales exposure at the same time. Which customers depend on discretionary spending, transport, energy production or Gulf-linked supply? Which invoices are fixed, indexed or open to renegotiation? Which receivables would become dangerous if a major customer slowed orders? Put revenue and cost exposure in the same register.
Add compliance and duty of care. Identify Iran-linked counterparties, beneficial owners, banks, vessels, insurers, payment routes and travel. A sanctions question should move to qualified counsel or the relevant official authority. A safety question should move to the operator, insurer and maritime or travel guidance, not stay in an editorial checklist.
The next 30 days: change pricing, contracts, sourcing and cash rules
Shorten quote validity where costs are moving faster than the sales cycle. Write a fuel or commodity clause that identifies the reference, base, threshold, calculation, timing and reversal. A vague right to add a surcharge can create a customer dispute. A transparent formula gives the buyer a way to audit and budget the change.
Qualify alternatives before switching. Compare landed cost, lead time, minimum order, specification, certification, failure risk, currency, payment and inventory. A cheaper distant supplier can increase cash tied up in transit. A domestic supplier can reduce route risk and still be constrained by imported feedstock. Run a sample order or quality check before moving critical volume.
Stress liquidity with the scenario that matches the company's weakest pricing power. Include tax, payroll, debt service and covenant tests. Contact a lender or insurer before a breach or loss, when options are broader. If receivables are the larger risk, review customer limits, deposits, milestones and credit insurance rather than focusing only on fuel.
The next 90 days: build a business that gains options from volatility
Reduce fuel intensity where the payback survives a lower-price case. Route planning, idle reduction, preventive maintenance, load consolidation, building controls, insulation, heat recovery, electrified equipment and fleet changes solve different problems. Use measured consumption and operating hours to rank projects instead of choosing the most visible technology.
Diversify customers and suppliers around capabilities the business can deliver profitably. Energy investment can create demand for maintenance, safety, fabrication, environmental, digital, accommodation and logistics work. Import substitution can create demand for domestic materials and packaging. Each opportunity still needs a buyer, specification, sales cycle, capacity plan and margin.
Assign triggers. Examples include a benchmark fuel price, supplier lead time, route closure, customer cancellation rate, gross-margin floor, receivable days or credit-line utilization. Each trigger needs an owner and action. Monitoring without a pre-agreed decision can leave the business watching a chart while cash runs out.
A 48-hour, 30-day and 90-day response system
The sequence moves from exposure measurement to commercial changes, resilience investments and monitored decision triggers.
What this shows: The decision tree starts with a 48-hour exposure register, moves to 30-day contract, pricing, sourcing and compliance changes, then to 90-day diversification, efficiency and monitoring work with named owners and triggers.
Source: Bank of Canada, Global Affairs Canada, FINTRAC and CER. Records: BOC-BOS-2026-Q2, CA-FINTRAC-IRAN-2026, CA-GAC-SANCTIONS-2026-08-14, CER-CANADA-PROFILE-2026
Sanctions and Iran-linked transactions
Canada's Special Economic Measures Regulations for Iran prohibit defined dealings with listed persons and entities and cover property, financial services, goods and facilitation in specified circumstances. Global Affairs Canada announced 5 additional listings on August 14, 2026 in connection with what the department described as obstruction of navigation rights around the Strait. The Justice Laws consolidation verified on August 28, 2026 said it was current only to June 21, 2026 and last amended March 25, 2026, so it must be read with later official amending records and the current Global Affairs sanctions material. The consolidated sanctions list remains an administrative aid rather than the controlling law.
Global Affairs Canada says Canadian sanctions apply to persons in Canada and Canadians abroad, and compliance with another jurisdiction's sanctions does not establish compliance with Canadian law. Its general due-diligence guidance advises Canadian individuals and entities to screen names against official lists and examine indirect associations, ownership and control. As a newsroom risk-management step, a business with Gulf-linked trade can also ask its qualified advisers whether vessel history, flag, insurer, ship-to-ship activity, AIS gaps or payment routing require enhanced review.
FINTRAC requires covered reporting entities to treat every transaction originating from or bound for Iran as high risk regardless of amount, verify the identity of the requesting or benefiting client, apply enhanced measures, keep records and assess sanctions-evasion risk. Those obligations apply to defined reporting entities. Other businesses still need to follow sanctions law and should obtain qualified advice for a specific transaction.
Insurance, trade finance and contract performance
A sale can be lawful and still fail operationally because a bank rejects the payment, an insurer excludes the voyage, a vessel misses the delivery window or a counterparty cannot perform. Review the full chain before promising a delivery date. Letters of credit, correspondent banks, currency, insurer approval, vessel acceptance and port instructions can each become a gate.
War-risk and force-majeure language does not answer every delay automatically. Ask counsel whether the clause defines the event, requires notice or mitigation, and covers the claimed cause of non-performance. Preserve notices, supplier records, route instructions, insurer communication and mitigation attempts for that review.
No official Canadian dataset isolates Hormuz-related marine premiums, rejected letters of credit or insurance claims. The article therefore does not publish a percentage increase for those costs. Businesses should use live quotes and their own transaction documents.
What public policy can and cannot do
Canada supported the IEA response with added industry production. The federal government suspended the excise tax on gasoline, diesel and aviation fuel from April 20 through September 7, 2026. Finance Canada said the temporary measure was expected to reduce regular gasoline bills by up to 10 cents per litre and diesel by up to 4 cents per litre. It is not a wholesale-price cap, and the actual pump price still reflects market movements, margins and other taxes. Monetary policy faces a harder trade-off when energy prices raise inflation while uncertainty weakens activity.
Longer-term electricity, nuclear, pipeline, port and LNG strategies can reduce or redirect energy exposure. They operate on different timelines. A transmission line or export terminal under study is not relief for next month's diesel bill. The business case should state whether a measure affects days, quarters or years.
Canada's energy base, electricity system, Pacific and Atlantic access and technical capacity create options over time. The constraint is how quickly infrastructure, contracts and operating capacity can connect those assets to a buyer. Next month's diesel budget and a five-year terminal strategy therefore belong in different decisions.
Method, limits and the update rule
Every factual link on this page points to a government, regulator, Crown institution or intergovernmental body. Non-government search results were used only to understand reader questions and common formats. Official estimates based on commercial vessel data remain official estimates, not primary customs declarations or physical measurements.
The derived data package records source identifiers, units, periods, evidence states and formulas. Percentage changes compare like-for-like official periods. The scenario chart uses visible assumptions and does not assign probability. Provincial discussion uses separate channels because production, imports, prices, royalties and policy measures are not compatible inputs for a single score.
This page requires a fresh verification when the IMO changes its navigation assessment, a ceasefire or maritime framework changes, IEA or EIA publishes new flow estimates, Canada changes sanctions, or the Bank of Canada and Statistics Canada publish material new evidence. A current conflict article without a visible cutoff is already stale. The reporting cutoff here is August 28, 2026.
Government links used for this briefing
These links point to federal, provincial, territorial, municipal, intergovernmental, or official data sources. Readers should confirm current eligibility and deadlines directly with the issuing government before applying.
Current neutral status, verified attacks, fatalities and stranded-vessel estimate as of August 28, 2026.
Intergovernmental / EvidenceMiddle East shipping and seafarer hubInternational Maritime OrganizationTransit graphics, evacuation records, safety guidance and current incident links.
Intergovernmental / EvidenceConfirmed Middle East vessel incidentsInternational Maritime OrganizationVerified vessel incidents without assuming responsibility where the IMO does not assign it.
Intergovernmental / EvidenceIMO safe-passage framework decisionInternational Maritime OrganizationOfficial response to attacks, mines, threats and the purported closure.
Intergovernmental / EvidenceIMO evacuation framework beginsInternational Maritime OrganizationInitial June evacuation framework and official safety guarantees.
Intergovernmental / EvidenceIMO pauses Strait evacuationInternational Maritime OrganizationEvacuation pause after a renewed attack.
Intergovernmental / EvidenceIMO remarks on Iran's reopening announcementInternational Maritime OrganizationOfficial April record of continuing constraints after the reopening announcement.
Official data / EvidenceUKMTO Advisory 003-26United Kingdom Maritime Trade OperationsOfficial maritime advisory on the absence of a recognized navigation-warning closure notice.
Intergovernmental / EvidenceStrait of Hormuz oil-security fact sheetInternational Energy Agency2025 oil flows, seaborne share, route dimensions and crude bypass estimates.
Intergovernmental / EvidenceOil Market Report, August 2026International Energy AgencyGulf output, exports, late-July loadings, benchmark prices and product-market pressure.
Intergovernmental / EvidenceOil Market Report, July 2026International Energy AgencyJune Gulf export recovery and pre-conflict comparison.
Intergovernmental / EvidenceIEA collective oil actionInternational Energy AgencyOfficial 400 million barrel collective action.
Intergovernmental / EvidenceMiddle East maritime chokepoints monitorInternational Energy AgencyTransit monitoring and limits caused by AIS jamming, spoofing and dark vessels.
Intergovernmental / EvidenceGas Market Report, third quarter 2026International Energy AgencyGulf LNG share, lost loadings, alternative supply and bypass constraints.
Official data / EvidenceMiddle East conflict and energy securityU.S. Energy Information AdministrationQuarterly oil and LNG flow estimates through the Strait and tracking limitations.
Official data / EvidencePetroleum markets in the second quarterU.S. Energy Information AdministrationOfficial Brent range and market observations through June 2026.
Official data / EvidenceWorld oil transit chokepointsU.S. Energy Information AdministrationPotential Saudi and UAE bypass capacity before the conflict.
Official data / EvidenceDated crude bypass estimateU.S. Energy Information AdministrationLower dated estimate of unused Saudi and UAE bypass capacity under different assumptions.
Official data / EvidenceWhite House protected-corridor claimThe White HouseAttributed U.S. claim that is not reconciled with neutral daily-flow estimates.
Intergovernmental / EvidenceHormuz disruption and global trade strainUN Trade and DevelopmentEstimated all-vessel transit collapse and wider trade channels.
Federal / ComplianceCurrent Canadian sanctions actionGlobal Affairs CanadaCanadian sanctions announcement linked to navigation around the Strait.
Intergovernmental / EvidenceUN record of the conflict openingUnited NationsNeutral high-level account of the February 28 strikes and ensuing regional attacks.
Intergovernmental / EvidenceUN statement on Iran's reopening announcementUnited NationsAttributed reopening announcement, not proof that commercial conditions normalized.
Intergovernmental / EvidenceUN account of the mid-June arrangementUnited NationsOfficial account used alongside EIA where source dates differ.
Federal / ComplianceCanadian sanctions backgrounderGlobal Affairs CanadaNamed listings and the Government of Canada's attributed conflict chronology.
Federal / ComplianceSpecial Economic Measures Regulations for IranDepartment of Justice CanadaConsolidated legal text for Canadian Iran sanctions.
Federal / ComplianceConsolidated Canadian Autonomous Sanctions ListGlobal Affairs CanadaOfficial administrative list, its no-force-of-law warning and its stated currentness limitation.
Federal / ComplianceCanadian sanctions essential informationGlobal Affairs CanadaOfficial scope, other-jurisdiction, due-diligence, screening, ownership and control guidance.
Federal / ComplianceFINTRAC Iran transaction directiveFINTRACHigh-risk transaction, identity, enhanced measure and record requirements for covered reporting entities.
Federal / EvidenceCanadian contribution to IEA actionNatural Resources CanadaCanada's 23.6 million barrel industry-production commitment.
Federal / EvidenceSpring Economic Update 2026Department of Finance CanadaOfficial mixed-impact, inflation, fiscal and macroeconomic scenario context.
Federal / EvidenceSpring Economic Update fuel-relief overviewDepartment of Finance CanadaExact products, dates and stated expected relief for the temporary federal fuel excise suspension.
Federal / EvidenceSummer 2026 trade and investment performance updateGlobal Affairs CanadaOfficial assessment of Canada's net-export position, gas-market transmission and uneven regional effects.
Official data / EvidenceBusiness Outlook Survey, first quarter 2026Bank of CanadaPre-war main survey plus targeted follow-up with exposed firms.
Official data / EvidenceBusiness Outlook Survey, second quarter 2026Bank of CanadaBusiness costs, price pass-through, regional activity, investment and oil-sector consultations.
Official data / EvidenceMiddle East war transmission and inflation risksBank of CanadaOfficial price-transmission estimates and their assumptions.
Official data / EvidenceOil-shock financial stress testBank of CanadaSevere scenario for credit and financial-system resilience, not a forecast.
Official data / EvidenceCanada energy profileCanada Energy RegulatorRefinery capacity, regional supply structure, imports and product-market context.
Official data / EvidenceRecord Canadian oil production in 2025Canada Energy RegulatorNational production and compatible provincial production shares.
Official data / EvidenceCanada-U.S. energy trade in 2025Canada Energy RegulatorCrude exports, destinations, natural-gas exports and LNG volumes.
Official data / EvidenceCanadian crude imports in 2025Canada Energy RegulatorNational and regional crude import volumes and sources.
Official data / EvidenceCanadian refinery runs in 2025Canada Energy RegulatorNational and regional refinery runs, capacity and utilization.
Official data / EvidenceCanadian oil pipeline throughput in 2025Canada Energy RegulatorMainline, Keystone and Trans Mountain throughput and capacity.
Official data / EvidenceCanadian natural-gas production in 2025Canada Energy RegulatorMarketable gas production and provincial concentration.
Official data / EvidenceCanadian LNG licence briefingCanada Energy RegulatorActive and approved long-term LNG export licences, with the distinction between licences and operating capacity.
Official data / EvidenceCanadian refined-product imports in 2025Canada Energy RegulatorProduct import volume, value, U.S. share and regional product differences.
Official data / EvidenceConsumer Price Index, July 2026Statistics CanadaGasoline, energy, all-items, gasoline-excluded and air-transportation price changes.
Official data / EvidenceIndustrial Product Price Index, July 2026Statistics CanadaFactory-gate energy, diesel, gasoline and resin price changes.
Official data / EvidenceEnergy statistics, May 2026Statistics CanadaCurrent Canadian production and LNG-volume context at the available monthly cutoff.
Official data / EvidenceBalance of international payments, second quarter 2026Statistics CanadaRecord quarterly crude and bitumen export value and Canada's goods-balance movement.